Case Report
Impact of Diabetes on the Nutritional Status of CKD Patients

Amalu B. Mathew*, Kundhala Ravi, and Gopalan T.R
Department of Clinical nutrition, SRU, Chennai, India
*Address for Correspondence: Amalu B. Mathew, Department of Clinical nutrition, SRU, Chennai, India, Tel: +919656666417; Email: [email protected]
Dates: Submitted: 21 December 2016; Approved: 06 January 2017; Published: 09 January 2017
How to cite this article: Mathew AB, Ravi K, Gopalan TR. Impact of Diabetes on the Nutritional Status of CKD Patients. Heighpubs Otolaryngol and Rhinol. 2017; 1: 001-004.
DOI: 10.29328/journal.hor.1001001
Copyright License: © 2017 Mathew AB, et al. This is an open access article distributed under the Creative Commons Attribution License, which permits unrestricted use, distribution, and reproduction in any medium, provided the original work is properly cited.

ABSTRACT
Background: Prevalence of malnutrition in Chronic Kidney Disease (CKD) patients is due to their lower appetite level. Diabetic patients experience polyphagia. Hence it is necessary to understand the impact of diabetes on the nutritional status of CKD patient.
Aim: To compare the nutritious status between the CKD patients with and without diabetes.
Objectives: To find out the impact of diabetes on the nutritional status of CKD patients.
Method and Materials: A prospective random sampling method was adopted to select the subjects. Eighty CKD patients were divided equally into two groups. Tool which has been used to collect the data was SOAP format.
Results: While comparing BMI between group 1(CKD without diabetes) and group 2(CKD with diabetes) it was noticed that the percentage of normal nourished subjects in group 2 were greater than that of group1. About 63% and 25% of subjects with CKD in group1 had normal BMI and grade 1 undernourished respectively. In group 2, about 75% and 10% of patients had normal BMI and grade 1 over nourished respectively. About 80% of subjects in group 2 were on insulin treatment. About 88% of subjects in group1 were anorexic and about 55% and 25% of subjects in group 2 had polyphagia and normal appetite respectively. The difference in the energy and protein intake between the two groups was statistically significant at p<0.01 level.
Conclusions: It can be concluded from the above study that a better nutritional status was found in the CKD patients with Diabetes Mellitus (DM) than the CKD patients without DM which may be due to their normal appetite/ polyphagia, hence allowing a better food intake among group2 subjects. Weight gain in CKD with DM patients may be due to increase in fat mass which is subsequent to lipogenic effect of insulin.
INTRODUCTION
An epidemic of chronic non communicable diseases including chronic kidney disease (CKD) is encountered globally requiring urgent preventive measures to be practiced. Diabetes Atlas 2006 published by the International Diabetes Federation states that 40.9 million diabetics currently in India is expected to rise to 69.9 million by 2025. Obesity, hypertension and diabetes resulted due to changes in lifestyle and urbanization has led to an increased risk of CKD. Years of high blood pressure can damage the delicate filters in the kidney, leading to less efficient removal of waste products from the kidney [1]. About 40% of patients with renal failure, are malnourished and it is associated with increased morbidity and mortality [2]. They experience reduced body weight, depleted fat stores, loss of muscle mass and low levels of serum albumin, transferrin, pre-albumin and other visceral proteins. The etiology of malnutrition in CRF (Chronic Renal Failure) is complex and may include many factors. Increased resting energy expenditure, poor food intake with anorexia, nausea and vomiting due to uraemic toxicity, hormonal derangements, and acidosis are the factors leading to malnourished status [3].
METHODS
The study was carried out with the aim to compare the nutritional status of CKD patients with and without diabetes. The objective of the study was to find the prevalence of malnutrition in CKD patients with and without Diabetes Mellitus (DM) and to compare the energy and protein intake between CKD patients with and without Diabetes. Purposive observational data were collected on patients admitted to service side of Sri Ramachandra Medical Centre and Research Institute, Chennai over a 3 month period. The sample size chosen for the study was 80 subjects who were divided equally into 2 groups: group 1 consists of forty patients with CKD without diabetes and group 2 consists of forty CKD patients with Diabetes. Inclusion criteria were CKD without co morbid condition; CKD with DM and age above 20 years. Exclusion criteria were pregnancy, pediatric population and CKD with other co morbid condition. Nutrition screening is useful in identifying those at risk of malnutrition. Body Mass Index (BMI) and Mid-arm circumference (MAC) were collected for anthropometric data. In this study biochemical parameters like hemoglobin, Fasting blood sugar, BUN, creatinine, and albumin were collected. Nutrient intake was measured using 24hr recall or diet history. Food frequency questionnaire (FFQ) was used to estimate the intake of nutrients. The data collected was subjected to statistical analysis like: percentage, arithmetic mean, standard deviation, students‘t’ test and Pearson correlation.
RESULTS AND DISCUSSION
The demographic data of the subject includes age, gender, socio-economic status and social habits. Majority of the subjects in group 1 were in the age group of 51-60 years (30%) and that in group 2 were in the age group of greater than 60 years (40%). Among 80 CKD subjects in both the groups majority of them were males. According to Kuppuswamy’s classification about 55% of subjects were in low socio-economic status and remaining 45% were under middle class. It was observed that majority of subjects in group2 were on insulin treatment (80%) and remaining on OHA (20%). Diabetic Nephropathy will be aggravated by a poor control of blood sugar. Insulin treatment is a good approach to treat Diabetic Nephropathy [4]. About 88% of subjects of group1 were anorexic. Out of 40 subjects assessed in group 2, it was found that 55% of subjects were polyphagic and 25% had normal appetite. The intracellular starvation is polyphagia. Since there is absence or resistance to insulin action, glucose cannot move into the cells and the cells are starved [5]. High insulin levels will increase appetite and cause to develop more cravings for sugar and refined carbohydrate [6].
While comparing BMI between group 1 and group 2, the percentage of normal nourished subjects in group 2 was greater than group 1. About 63% and 25% of subjects with CKD had normal BMI and grade 1 under nourished respectively. About 75% and 9% of group 2 subjects had normal BMI and grade 1 over nourished respectively (Figure 1).
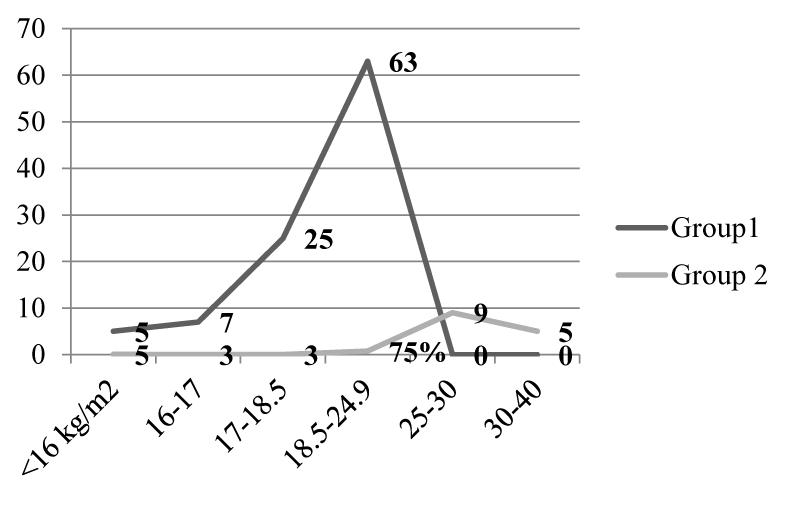
Figure 1: Distribution of subjects based on the BMI. (Group1: CKD; Group2: CKD with DM).
Table 1 indicates the comparison of anthropometric data between the two groups. Comparing the anthropometric variables like weight, BMI and MAC between group 1 and group 2, it was found that group 2 had higher value than group 1 and the difference was statistically significant at p< 0.01 level. Weight gain in CKD patients with DM may be due to increase in fat mass which is subsequent to lipogenic effect of insulin and can be corrected by increasing the activity levels [7].
| Table 1: Comparison of anthropometric data between the two groups. | ||||
| Anthropometry | Group1 | Group2 | ‘t’ value | ‘p’ value |
| MEAN±SD | MEAN±SD | |||
| Weight (kg) | 52.5±4.85 | 58.2±8.3 | 3.945 | 0.010* |
| BMI (kg/m2) | 19.5±2.18 | 21.7±3.1 | 3.637 | 0.005* |
| MAC (cm) | 25.3±1.84 | 31.9±4.1 | 9.282 | 0.010* |
| (Group1: CKD; Group2: CKD with DM), *Significant at p<0.01 level; NS non-significant | ||||
From the table 2, it is clear that there is no much difference in the mean and standard deviation of biochemical parameters between the two groups except for FBS value. The mean FBS of group 2 was 188.98 (± 33.26) mg/dl and group 1 was 85.88 (± 7.4) mg/dl and the difference was found to be significant at 0.01 level. Energy intake should be carefully monitored for Diabetic Nephropathy patients with high serum creatinine. Creatinine and urea nitrogen levels will be elevated by insufficient energy intake, whereas high energy intake is not helpful for controlling blood sugar levels [8]. The percentage of presence of symptoms like pale nail and pale conjunctiva was higher in the group1 (87.5%) than group 2 (85%). Due to reduced erythropoietin production abnormally low hemoglobin concentrations is seen leading to renal anemia [9]. About 40% of subjects in the group 2 had an energy intake between 1100-1200 kcal and 32.5% of subjects in group 1 had an energy intake between 900-1000 kcal. It was seen that about 50% of subjects in the group 2 had a protein intake between 40-45 gm. About 65% of group 1 subjects had protein intake between 25-30 gm. The difference in both the energy and protein intake between the two group was statistically significant at p< 0.01 level.
| Table 2: Comparison of biochemical parameters between the two groups. | ||||
| Biochemical parameters | Group1 | Group2 | ‘t’ value | Level of significance |
| MEAN±SD | MEAN±SD | |||
| Hemoglobin (g/dL) | 9.045±1.018 | 9.21±1.029 | 0.720 | NS |
| FBS (mg/dL) | 85.87±7.41 | 188.97±33 | 19.134 | P<0.01** |
| BUN (mg/dL) | 50.1±8.18 | 50.1±8.18 | 0.000 | NS |
| Creatinine (mg/dL) | 3.84±0.9 | 3.755±0.91 | 0.409 | NS |
| Albumin (g/dL) | 2.047±0.55 | 2.047±0.543 | 0.000 | NS |
| (Group1: CKD; Group2: CKD with DM); NS: non-significant; **significant at 0.01 level | ||||
Table 3 indicates the correlation between the energy intake and the weight of the subjects belonging to group 2. A significant correlation has been noted in this group as the appetite level of this group was higher compared to group 1; the energy of intake was higher and has reflected on the weight of the subjects. Malnutrition and underweight is quite common in patients with CKD. There will be a gain in weight if intake is greater than expenditure [10].
| Table 3: Correlation between energy intake Vs weight of group 2 subjects. | ||
| Energy (kcal) | Weight (kg) | r- value |
| 1072±113 | 58.2±8.3 | 0.403** |
| ** Correlation is significant at 0.01 level; Group2: CKD with DM | ||
Table 4 indicates the correlation between the energy intake and MAC of the subjects belonging to group 2. A significant correlation has been noted in this group as the appetite level of this group was higher compare to group 1; the energy of intake was higher and has reflected on the MAC of the subjects. MAC indicates somatic protein and fat stores. Malnutrition and underweight is quite common in patients with CKD. Weight gain was not only due to an increase in food intake, while REE per lean body mass decreased, suggesting a role for increased efficiency in fuel usage due to improved glycaemic control with insulin therapy [11].
| Table 4: Correlation between energy intakes Vs MAC of group 2 subjects. | ||
| Energy (kcal) | MAC (cm) | r- value |
| 1072±113 | 31.97±4.11 | 0.598** |
| Group2: CKD with DM; ** correlation is significant at 0.01 level | ||
CONCLUSION
Protein-energy malnutrition and impaired quality of life are the experienced in chronic kidney disease. Cause of malnutrition in renal failure is multifactorial, but gastrointestinal disturbances frequently contribute to decreased food intake. As the conclusion of above study a better nutritious status has been found in CKD patients with DM due to their normal appetite or polyphagia and also due to insulin treatment. The lipogenic effect of insulin may leads to weight gain [1]. Poor nutritious status has been found in patients with CKD. Nutrition status can be improved by addressing GI complications.
REFERENCES
- Coles GA. Body composition in chronic renal failure. Q J Med. 1972; 41: 25-47. Ref.: https://goo.gl/4t1sQ70
- Cano NJ, Roth H, Aparicio M, Azar R, Canaud B, et al. Malnutrition in hemodialysis diabetic patients: evaluation and prognostic influence. Kidney Int. 2002; 62: 593-601. Ref.: https://goo.gl/1hWmfX
- Warram JH, Gearin G, Laffel L, Krolewski AS. Effect of duration of type I diabetes on the prevalence of stages of diabetic nephropathy defined by urinary albumin/creatinine ratio. J Am Soc Nephrol. 1996; 7: 930-937. Ref.: https://goo.gl/QGXeLJ
- Gross JL, de Azevedo MJ, Silveiro SP, Canani LH, Caramori ML, et al. Diabetic nephropathy: diagnosis, prevention, and treatment. Diabetes Care. 2005; 28: 164-176. Ref.: https://goo.gl/5HRcSa
- Hall JE, Guyton AC. Guyton and Hall textbook of medical physiology, Insulin, glucagon, and diabetes mellitus, 12th edition. Saunders Elsevier. 2011. Ref.: https://goo.gl/h8zCDW
- Mudaliar S, Edelman SV. Insulin Therapy in Type 2 Diabetes. Endocrinology and Metabolism Clinics. 2001; 30: 1-32. Ref.: https://goo.gl/J39P8w
- Jacob AN, Salinas K, Adams-Huet B, Raskin P. Potential causes of weight gain in type 1 diabetes mellitus. Diabetes Obes Metab. 2006; 8: 404-411. Ref.: https://goo.gl/QkI1Ey
- http://www.diabetes-kidney.org/diabetic-nephropathy/631.html
- Alebiosu CO, Ayodele OE. The global burden of chronic kidney disease and the way forward. Ethn Dis. 2005; 15: 418-423. Ref.: https://goo.gl/5TC0T0
- Garrow JS. Energy balance and obesity in man, (2nd edn). Elsevier Holland. 1978. Ref.: https://goo.gl/mcMGNR
- Jacob AN, Salinas K, Adams-Huet B, Raskin P. Weight gain in type 2 diabetes mellitus. Diabetes Obes Metab. 2007; 9: 386-393. Ref.: https://goo.gl/K9veHf